Preamble
[19]:
try:
    import pgmuvi
except (ImportError, ModuleNotFoundError):
    %pip install -q git+https://github.com/ICSM/pgmuvi.git
    import pgmuvi
[21]:
# Imports and seeds for reproducibility
import gpytorch
from gpytorch.likelihoods import FixedNoiseGaussianLikelihood

seed = 0
import torch
torch.manual_seed(seed)

import numpy as np
np.random.seed(seed)

import random
random.seed(seed)

from pgmuvi.lightcurve import Lightcurve
from gpytorch.constraints import Interval
import pgmuvi.gps as gps
from pgmuvi import synthetic
from pgmuvi.preprocess import subsample_lightcurve

SEED = 0
TRAINING_ITER = 1000
DTYPE = torch.float64
DEVICE = torch.device("cpu")
The Lightcurve object
The central object in pgmuvi is the Lightcurve class. It can store either a light curve defined for a single wavelength (a “1D light curve”) or a set of light-curve observations defined over time and wavelength (a “2D light curve”).
At the very least, a Lightcurve stores:
xdata— the independent-variable datafor a 1D light curve: time
for a 2D light curve: a 2-column array, with time in the first column and wavelength in the second
ydata— the flux valuesyerr— the flux uncertainties, if availableband— an optional array of per-row string labels, mainly useful for manipulating 2D light curves
In addition to the core arrays, the class also supports a small amount of lightweight metadata:
name— a human-readable name for the light curvetime_units— passed at construction time so that the time axis can be converted internally to days
This is useful, but it is also important to be precise about what the class does not currently provide.
The current implementation is not a general metadata container.
For example, there is no dedicated built-in schema for storing and round-tripping arbitrary metadata such as:
source name
telescope/instrument
photometric system
physical flux units
provenance information
So if you need richer metadata, you should currently manage that outside the Lightcurve object or extend the class explicitly.
A Lightcurve object can be instantiated either by providing xdata, ydata, and optionally yerr directly, or by reading a CSV file with Lightcurve.from_csv().
In this notebook, we will demonstrate some features available for Lightcurve objects to manipulate 1D and 2D light curve data.
Data structure and invariants
Before using the Lightcurve object, it is essential to understand the assumptions it makes about the input data. Many downstream methods (especially period finding and GP fitting) will silently fail or produce misleading results if these assumptions are violated.
A Lightcurve is constructed from:
time— observation timesflux— measured flux valuesflux_err— uncertainties on fluxwavelength— wavelength(s) corresponding to the observationsband(optional but recommended) — string labels identifying each wavelength channel
1D lightcurve (single band)
time: shape(N,)flux: shape(N,)flux_err: shape(N,)wavelength: scalar or(N,)band: single string or(N,)constant
2D lightcurve (multi-band)
time: shape(N,)flux: shape(N, M)flux_err: shape(N, M)wavelength: shape(M,)band: shape(M,)(array of strings)
Each column in flux corresponds to one band.
Critical invariants
The following must hold:
len(time) == flux.shape[0] == flux_err.shape[0]flux.shape == flux_err.shapeNumber of bands must match:
flux.shape[1] == len(wavelength) == len(band)(for 2D case)
No implicit reshaping is performed — mismatches should raise errors
Common pitfalls
Mixing 1D and 2D inputs unintentionally
Providing
bandlabels as floats instead of stringsMismatched number of bands vs flux columns
Silent broadcasting errors if shapes are inconsistent
Unsorted time arrays (not always enforced!)
In the next cell, we explicitly test these constraints.
[22]:
import numpy as np
from pgmuvi.lightcurve import Lightcurve

# ------------------------------------------------------------
# Valid 2-D example
#
# In this codebase, a multiband light curve is stored with:
#   xdata.shape == (N, 2)
# where:
#   xdata[:, 0] = time
#   xdata[:, 1] = wavelength
#
# ydata and yerr are 1-D arrays of length N
# band is optional, but if provided for 2-D data it must be a
# 1-D array of strings with exactly one label per observation row
# (so len(band) == N, not number of unique wavelengths).
# ------------------------------------------------------------

xdata = np.array([
    [0.0, 1.25],
    [1.0, 1.25],
    [2.0, 1.25],
    [0.5, 2.20],
    [1.5, 2.20],
    [2.5, 2.20],
], dtype=float)

ydata = np.array([10.0, 10.4, 10.2, 7.8, 8.1, 7.9], dtype=float)
yerr = np.array([0.2, 0.2, 0.2, 0.15, 0.15, 0.15], dtype=float)

band = np.array(["J", "J", "J", "K", "K", "K"])

lc = Lightcurve(
    xdata,
    ydata,
    yerr=yerr,
    band=band,
)

print("Valid Lightcurve created.")
print("xdata shape:", lc.xdata.shape)
print("ydata shape:", lc.ydata.shape)
print("ndim:", lc.ndim)
print("band:", lc.band)


# ------------------------------------------------------------
# Invalid example 1: band length mismatch
#
# For 2-D light curves, band must have one entry per row.
# ------------------------------------------------------------
try:
    bad_band = np.array(["J", "K"])  # incorrect length
    lc_bad_band = Lightcurve(
        xdata,
        ydata,
        yerr=yerr,
        band=bad_band,
    )
except Exception as e:
    print("\nExpected failure (band length mismatch):")
    print(type(e).__name__, e)


# ------------------------------------------------------------
# Invalid example 2: band is not 1-D
# ------------------------------------------------------------
try:
    bad_band_shape = np.array([["J"], ["J"], ["J"], ["K"], ["K"], ["K"]])
    lc_bad_band_shape = Lightcurve(
        xdata,
        ydata,
        yerr=yerr,
        band=bad_band_shape,
    )
except Exception as e:
    print("\nExpected failure (band must be 1-D):")
    print(type(e).__name__, e)


# ------------------------------------------------------------
# Invalid example 3: NaN in xdata
#
# The xdata setter explicitly rejects NaNs.
# ------------------------------------------------------------
try:
    xdata_nan = xdata.copy()
    xdata_nan[2, 0] = np.nan
    lc_nan = Lightcurve(
        xdata_nan,
        ydata,
        yerr=yerr,
        band=band,
    )
except Exception as e:
    print("\nExpected failure (NaN in xdata):")
    print(type(e).__name__, e)


# ------------------------------------------------------------
# Valid 1-D example
#
# For a 1-D light curve:
#   xdata is just time
#   ydata is flux
#   yerr is flux uncertainty
#
# band may be omitted, or may be a single shared label.
# ------------------------------------------------------------
time = np.array([0.0, 1.0, 2.0, 3.0], dtype=float)
flux = np.array([12.1, 12.4, 12.0, 12.3], dtype=float)
flux_err = np.array([0.1, 0.1, 0.1, 0.1], dtype=float)

lc_1d = Lightcurve(
    time,
    flux,
    yerr=flux_err,
    band=np.array(["V"]),
)

print("\nValid 1-D Lightcurve created.")
print("xdata shape:", lc_1d.xdata.shape)
print("ydata shape:", lc_1d.ydata.shape)
print("ndim:", lc_1d.ndim)
print("band:", lc_1d.band)
Valid Lightcurve created.
xdata shape: torch.Size([6, 2])
ydata shape: torch.Size([6])
ndim: 2
band: ['J' 'J' 'J' 'K' 'K' 'K']

Expected failure (band length mismatch):
ValueError Length of 'band' (2) does not match the expected number of rows (6).

Expected failure (band must be 1-D):
ValueError 'band' must be a 1-D array-like of strings (shape (n,)); got shape (6, 1).

Valid 1-D Lightcurve created.
xdata shape: torch.Size([4])
ydata shape: torch.Size([4])
ndim: 1
band: ['V']
/usr/local/lib/python3.12/dist-packages/pgmuvi/lightcurve.py:1840: UserWarning: The function expects a torch.Tensor as input.Your data will be converted to a tensor.
  xdata = self._ensure_tensor(xdata)
/usr/local/lib/python3.12/dist-packages/pgmuvi/lightcurve.py:1841: UserWarning: The function expects a torch.Tensor as input.Your data will be converted to a tensor.
  ydata = self._ensure_tensor(ydata)
/usr/local/lib/python3.12/dist-packages/pgmuvi/lightcurve.py:1843: UserWarning: The function expects a torch.Tensor as input.Your data will be converted to a tensor.
  yerr = self._ensure_tensor(yerr)
/tmp/ipykernel_2728/3967147311.py:89: UserWarning: Dropped 1 row(s) containing non-finite (NaN or Inf) values.
  lc_nan = Lightcurve(
/tmp/ipykernel_2728/3967147311.py:89: UserWarning: Fewer than 10 elements remain after dropping 1 rows, take care interpreting results!
  lc_nan = Lightcurve(
[23]:
# Minimal demonstration of lightweight metadata currently supported by Lightcurve

import numpy as np
from pgmuvi.lightcurve import Lightcurve

time_hours = np.array([0.0, 12.0, 24.0, 36.0], dtype=float)
flux = np.array([1.0, 1.1, 0.9, 1.05], dtype=float)
flux_err = np.array([0.05, 0.05, 0.05, 0.05], dtype=float)

lc_meta = Lightcurve(
    time_hours,
    flux,
    yerr=flux_err,
    name="Example light curve",
    time_units="hr",
    band=np.array(["V"]),
)

print("name:", lc_meta.name)
print("band:", lc_meta.band)
print("xdata (stored internally in days):")
print(lc_meta.xdata)

print("\nDoes the object expose a dedicated metadata container?")
print("meta attribute present ->", hasattr(lc_meta, "meta"))
name: Example light curve
band: ['V']
xdata (stored internally in days):
tensor([0.0000, 0.5000, 1.0000, 1.5000])

Does the object expose a dedicated metadata container?
meta attribute present -> False
Missing and non-finite data
The current Lightcurve implementation does not expose a dedicated masking interface such as a boolean mask attribute or a .mask() method.
Instead, the behavior is:
At direct construction time (``Lightcurve(…)``)
if the main data arrays are 1D in the supported standard format, rows containing NaN or Inf in
xdata,ydata, oryerrare dropped automaticallya warning is emitted if rows are dropped
if no valid rows remain, a
ValueErroris raised
At CSV read time (``Lightcurve.from_csv(…)``)
rows containing missing values in the relevant columns are dropped automatically before the object is constructed
empty strings in string-valued columns are also treated as missing
if all rows are dropped, a
ValueErroris raised
So the package currently follows a drop-invalid-rows strategy rather than a mask-and-retain strategy.
This is important because it means:
the number of rows in the final
Lightcurvemay be smaller than the input datainvalid rows are not preserved for later masking/unmasking
if you want custom masking logic, you should apply it before constructing the
Lightcurve
[24]:
import numpy as np
import warnings
from pgmuvi.lightcurve import Lightcurve

# Example: direct Lightcurve construction drops rows with NaN/Inf
x_bad = np.array([
    [0.0, 0.8],
    [1.0, 0.8],
    [2.0, 0.8],
    [3.0, 0.8],
], dtype=float)

y_bad = np.array([1.0, np.nan, 1.2, np.inf], dtype=float)
yerr_bad = np.array([0.1, 0.1, 0.1, 0.1], dtype=float)
band_bad = np.array(["band 1", "band 1", "band 1", "band 1"])

with warnings.catch_warnings(record=True) as w:
    warnings.simplefilter("always")
    try:
      lc_clean = Lightcurve(
          x_bad,
          y_bad,
          yerr=yerr_bad,
          band=band_bad,
      )
      print("Input number of rows:", len(y_bad))
      print("Rows retained in Lightcurve:", len(lc_clean.ydata))
      print("Retained xdata:")
      print(lc_clean.xdata)
    except Exception as e:
      print("Expected failure:")
      print(type(e).__name__, e)
if w:
    print("\nWarning emitted during construction:")
    print(str(w[0].message))
Input number of rows: 4
Rows retained in Lightcurve: 2
Retained xdata:
tensor([[0.0000, 0.8000],
        [2.0000, 0.8000]])

Warning emitted during construction:
The function expects a torch.Tensor as input.Your data will be converted to a tensor.
[25]:
# Example: CSV reading also drops invalid rows automatically

csv_text = """time,wavelength,flux,flux_err,band
0.0,0.8,1.00,0.10,band 1
1.0,0.8,nan,0.10,band 1
2.0,0.8,1.20,0.10,band 1
3.0,0.8,1.30,0.10,
4.0,0.8,1.40,0.10,band 1
"""

with open("lightcurve_with_missing_rows.csv", "w") as f:
    f.write(csv_text)

with warnings.catch_warnings(record=True) as w:
    warnings.simplefilter("always")
    lc_csv_clean = Lightcurve.from_csv("lightcurve_with_missing_rows.csv")

print("Rows retained after from_csv:", len(lc_csv_clean.ydata))
print("Retained xdata:")
print(lc_csv_clean.xdata)
print("Retained band labels:")
print(lc_csv_clean.band)

if w:
    print("\nWarning emitted during CSV read:")
    print(str(w[0].message))
Rows retained after from_csv: 4
Retained xdata:
tensor([0., 2., 3., 4.])
Retained band labels:
['band 1']

Warning emitted during CSV read:
Dropped 1 row(s) containing NaN values.
Generating synthetic data
Synthetic data can of course be generated manually, but PGMUVI also has built-in methods to generate such data. We will demonstrate both these methods below.
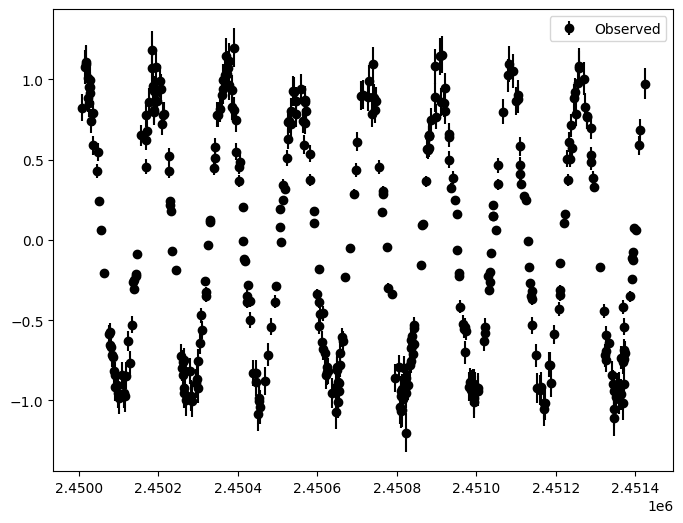
The following generates a 1D light curve with data generated manually
[26]:
""" Manual method: generate a perturbed sine curve with one period component"""

P = np.random.uniform(30, 300)  # 137. #Days!
print("True period: ", P, " days")
n_data = 400
jd_min = 2450000
n_periods = np.random.uniform(3, 10)
jd_max = jd_min + P * (n_periods)
print("Simulating for ", n_periods, " periods")

# generate data from a simple case - superimpose two sine curves and add noise
timestamps_1d = torch.Tensor(
    np.random.uniform(jd_min, jd_max, size=n_data)
)  # generate random x data here
fluxes_1d = torch.sin(timestamps_1d * (2 * np.pi / P))  # generate random y data here
fluxes_1d += 0.1 * torch.randn_like(fluxes_1d)
flux_err_1d = 0.1 * fluxes_1d.abs()

lc1d_manual = Lightcurve(timestamps_1d, fluxes_1d, yerr=flux_err_1d)
True period:  178.17964606037768  days
Simulating for  8.006325564606936  periods
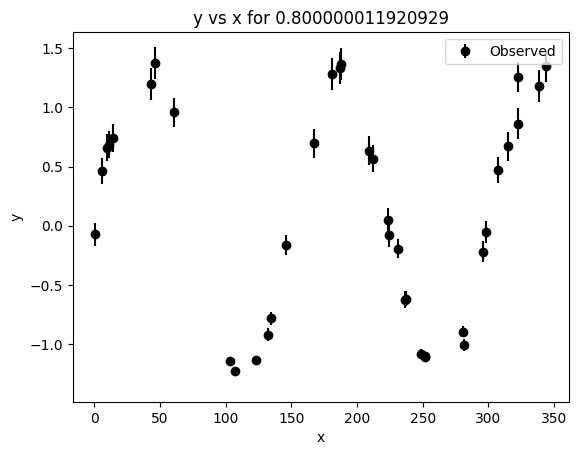
We can use the synthetic.py script instead. The following generates a 2D light curve with a single period component
[27]:
"""Generate a set of mono-periodic light curves using synthetic.py"""

n_per_band = (25, 40) # number of data points per light curve limited to this range

SINGLE_DATASET_CONFIG = dict(
    period=150,
    t_span=150 * 2.3,
    n_per_band=n_per_band,
    wavelengths=[0.8, 1.2, 2.2], # wavelengths in µm
    amplitude_law="extinction",
    seed=SEED,
)

lc2d_synth_1comp = synthetic.make_chromatic_sinusoid_2d(**SINGLE_DATASET_CONFIG)
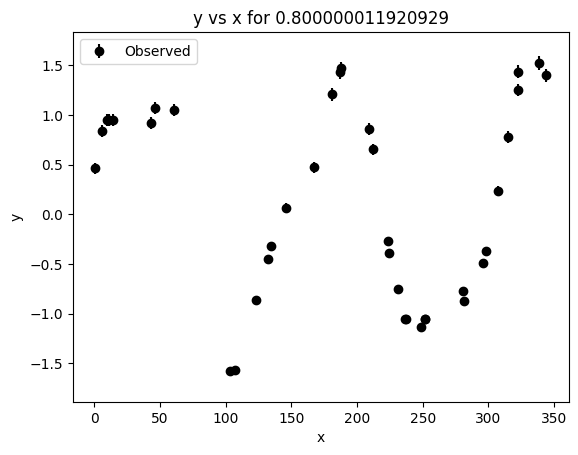
synthetic.py also generates a multi-component 2D light curve. The following creates a set of light curves with 2 components and a phase lag.
[28]:
""" Generate a set of light curves with two period components and a phase lag"""
n_per_band = (25, 40) # number of data points per light curve limited to this range

MULTI_DATASET_CONFIG = dict(
    components=[
        {"period": 150.0, "amplitude_fraction": 1.0, "phase": 0.0},
        {"period": 66.0, "amplitude_fraction": 0.3, "phase": np.pi / 2 * 0.85},
    ],
    t_span=150 * 2.3,
    n_per_band=n_per_band,
    wavelengths=[0.8, 1.2, 2.2],
    amplitude_law="extinction",
    noise_level=0.05,
    seed=SEED,
)

lc2d_synth_2comp = synthetic.make_multi_sinusoid_chromatic_2d(**MULTI_DATASET_CONFIG)
Visualization using the .plot() method
[29]:
_ = lc1d_manual.plot()
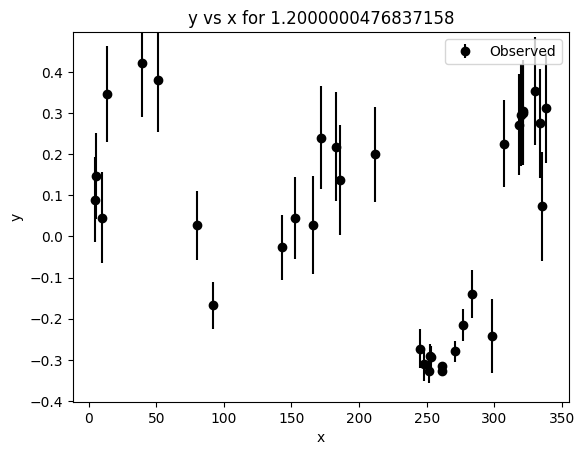
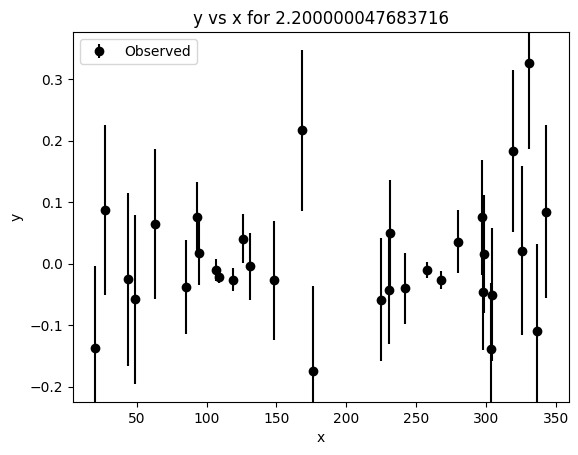
[30]:
_ = lc2d_synth_1comp.plot()


[31]:
_ = lc2d_synth_2comp.plot()
Input/output to CSV
We can use the .from_csv() and .to_csv() methods.
A few important details from the current code base:
.to_csv()always writes the columnstimewavelengthflux
it also writes
flux_errorifyerris presentbandif theLightcurvehas abandattribute
for a 1D light curve, the exported
wavelengthcolumn is written as0.0for every row.from_csv()auto-detects standard column names and reconstructs eithera 1D light curve, or
a 2D light curve if a numeric wavelength column with multiple unique values is present
if a string-valued band-ID column is present in the CSV,
.from_csv()can populate thebandattribute automatically
Because of this, a useful sanity check is a round-trip test:
lc.to_csv(...)
lc2 = Lightcurve.from_csv(...)
[32]:
# Simple CSV round-trip for a 1D light curve

outpath="lc1d_manual.csv"
_ = lc1d_manual.to_csv(outpath)
lc_read = Lightcurve.from_csv(outpath)

print("Written file:", outpath)
print("Original ndim:", lc1d_manual.ndim)
print("Read-back ndim:", lc_read.ndim)

print("\nArray comparisons:")
print("xdata equal ->", np.allclose(np.asarray(lc1d_manual.xdata), np.asarray(lc_read.xdata)))
print("ydata equal ->", np.allclose(np.asarray(lc1d_manual.ydata), np.asarray(lc_read.ydata)))

if lc1d_manual.yerr is not None and lc_read.yerr is not None:
    print("yerr equal  ->", np.allclose(np.asarray(lc1d_manual.yerr), np.asarray(lc_read.yerr)))
else:
    print("yerr equal  ->", lc1d_manual.yerr is None and lc_read.yerr is None)

print("\nBand information:")
print("original band ->", lc1d_manual.band)
print("read-back band ->", lc_read.band)
Written file: lc1d_manual.csv
Original ndim: 1
Read-back ndim: 1

Array comparisons:
xdata equal -> True
ydata equal -> True
yerr equal  -> True

Band information:
original band -> None
read-back band -> None
[33]:
# CSV round-trip for a 2D light curve with band labels

outpath_2d = "lc2d_synth_1comp.csv"
_ = lc2d_synth_1comp.to_csv(outpath_2d)
lc2d_read = Lightcurve.from_csv(outpath_2d)

print("Written file:", outpath_2d)
print("Original ndim:", lc2d_synth_1comp.ndim)
print("Read-back ndim:", lc2d_read.ndim)

print("\nShape checks:")
print("xdata shape:", np.asarray(lc2d_synth_1comp.xdata).shape, "->", np.asarray(lc2d_read.xdata).shape)
print("ydata shape:", np.asarray(lc2d_synth_1comp.ydata).shape, "->", np.asarray(lc2d_read.ydata).shape)

print("\nArray comparisons:")
print("xdata equal ->", np.allclose(np.asarray(lc2d_synth_1comp.xdata), np.asarray(lc2d_read.xdata)))
print("ydata equal ->", np.allclose(np.asarray(lc2d_synth_1comp.ydata), np.asarray(lc2d_read.ydata)))

if lc2d_synth_1comp.yerr is not None and lc2d_read.yerr is not None:
    print("yerr equal  ->", np.allclose(np.asarray(lc2d_synth_1comp.yerr), np.asarray(lc2d_read.yerr)))
else:
    print("yerr equal  ->", lc2d_synth_1comp.yerr is None and lc2d_read.yerr is None)

print("\nBand comparisons:")
print("original unique bands ->", np.unique(lc2d_synth_1comp.band) if lc2d_synth_1comp.band is not None else None)
print("read-back unique bands ->", np.unique(lc2d_read.band) if lc2d_read.band is not None else None)

if lc2d_synth_1comp.band is not None and lc2d_read.band is not None:
    print("band array equal ->", np.array_equal(np.asarray(lc2d_synth_1comp.band), np.asarray(lc2d_read.band)))
else:
    print("band array equal ->", lc2d_synth_1comp.band is None and lc2d_read.band is None)
Written file: lc2d_synth_1comp.csv
Original ndim: 2
Read-back ndim: 2

Shape checks:
xdata shape: (106, 2) -> (106, 2)
ydata shape: (106,) -> (106,)

Array comparisons:
xdata equal -> True
ydata equal -> True
yerr equal  -> True

Band comparisons:
original unique bands -> None
read-back unique bands -> None
band array equal -> True
The band attribute; selecting, dropping, merging, and concatenating light curves.
These operations are easy to misuse if one assumes Python-list-like in-place behavior.
In the current code base:
select_bands()returns a newLightcurvedrop_bands()returns a newLightcurvemerge()returns a newLightcurveLightcurve.concat()returns a newLightcurveLightcurve.from_csv()creates a newLightcurveto_csv()writes a file to disk and returns the output path; it does not modify the object
So none of the light-curve manipulation methods demonstrated in this section operate in place.
This matters because code such as
lc.select_bands(['band 2'])
does not alter lc unless the returned object is assigned:
lc2 = lc.select_bands(['band 2'])
The same logic applies to drop_bands(), merge(), and concat().
Populating the band attribute
band can be populated as follows if it doesn’t already exist
[34]:
bands = ['band 1', 'band 2', 'band 3']
u, c = np.unique(lc2d_synth_1comp.xdata[:, 1], return_counts=True)
ks = np.argsort(u)
band_value = np.repeat('band 1', lc2d_synth_1comp.xdata[:, 1].shape)
for uu in u[ks]:
  idx = np.where(lc2d_synth_1comp.xdata[:, 1] == uu)[0]
  band_value[idx] = bands[ks[np.where(u == uu)[0][0]]]

lc2d_synth_1comp.band = band_value
We can now write the updated Lightcurve object to a file for posterity
[35]:
_ = lc2d_synth_1comp.to_csv("lightcurve_band123.csv")
select_bands
Once a band attribute is available, we can select a subset of the light curve into a new Lightcurve object.
A few important details from the current implementation:
selection is based only on the
bandattributethe wavelength values in
xdata[:, 1]are not used for selectionthe input must be a sequence (
list,tuple, ornumpy.ndarray) of string labelsa bare string such as
lc.select_bands("band 2")is not allowednumeric selectors such as
1,1.0, etc. are rejectedif none of the requested labels are present, a
ValueErroris raisedthe returned object preserves the original row ordering
this method returns a new
Lightcurve; it does not modify the original in place
Also note that repeated labels in band are expected: for a 2D light curve, the same band label appears in many rows, one per observation in that band.
[36]:
lc23 = lc2d_synth_1comp.select_bands(['band 2', 'band 3'])

print("Original object unchanged?")
print("  lc23 is lc2d_synth_1comp ->", lc23 is lc2d_synth_1comp)

print(f"\nNo. of observations in lc2d_synth_1comp: {lc2d_synth_1comp.xdata[:, 1].shape}")
print("Breakdown by band:")
u, c = np.unique(lc2d_synth_1comp.band, return_counts=True)
for uu, cc in zip(u, c):
    print(uu, cc)

print(f"\nNo. of observations in lc23: {lc23.xdata[:, 1].shape}")
print("Breakdown by band:")
u, c = np.unique(lc23.band, return_counts=True)
for uu, cc in zip(u, c):
    print(uu, cc)

print("\nFirst few selected band labels (row ordering preserved):")
print(lc23.band[:10])
Original object unchanged?
  lc23 is lc2d_synth_1comp -> False

No. of observations in lc2d_synth_1comp: torch.Size([106])
Breakdown by band:
band 1 38
band 2 35
band 3 33

No. of observations in lc23: torch.Size([68])
Breakdown by band:
band 2 35
band 3 33

First few selected band labels (row ordering preserved):
['band 2' 'band 2' 'band 2' 'band 2' 'band 2' 'band 2' 'band 2' 'band 2'
 'band 2' 'band 2']
[37]:
# Edge cases for select_bands()

cases = [
    ("bare string", lambda: lc2d_synth_1comp.select_bands("band 2")),
    ("numeric selector", lambda: lc2d_synth_1comp.select_bands([2])),
    ("float selector", lambda: lc2d_synth_1comp.select_bands([2.0])),
    ("missing band", lambda: lc2d_synth_1comp.select_bands(["band 999"])),
]

for label, func in cases:
    try:
        _ = func()
        print(f"{label}: unexpectedly succeeded")
    except Exception as e:
        print(f"{label}: {type(e).__name__}: {e}")
        print("")
bare string: TypeError: 'bands' must be a sequence of band labels (list, tuple, or numpy.ndarray), not a bare string. To select a single band wrap it in a list: select_bands(['band 2'])

numeric selector: TypeError: Numeric selectors are not supported by select_bands; got 'int' (2). Use a string band label instead.

float selector: TypeError: Numeric selectors are not supported by select_bands; got 'float' (2.0). Use a string band label instead.

missing band: ValueError: None of the requested band labels ['band 999'] were found in this Lightcurve's 'band' attribute.
drop_bands
We can also create a new Lightcurve object by removing one or more bands from the original.
The validation rules are similar to those for select_bands:
removal is based only on the
bandattributethe input must be a sequence of strings
a bare string is rejected
if a requested label is not present, this is a no-op for that label
if all rows would be removed, a
ValueErroris raisedthe method returns a new
Lightcurve; it does not modify the original in place
So drop_bands() differs from select_bands() in one important way:
select_bands()raises an error if none of the requested labels existdrop_bands()simply returns a copy of the original object if the requested labels do not occur
[38]:
lc1 = lc2d_synth_1comp.drop_bands(['band 2', 'band 3'])

print("Original object unchanged?")
print("  lc1 is lc2d_synth_1comp ->", lc1 is lc2d_synth_1comp)

print(f"\nNo. of observations in lc1: {lc1.xdata[:, 1].shape}")
print("Breakdown by band:")
u, c = np.unique(lc1.band, return_counts=True)
for uu, cc in zip(u, c):
    print(uu, cc)
Original object unchanged?
  lc1 is lc2d_synth_1comp -> False

No. of observations in lc1: torch.Size([38])
Breakdown by band:
band 1 38
[39]:
# Edge cases for drop_bands()

# 1. Dropping a non-existent band: no-op copy
lc_noop = lc2d_synth_1comp.drop_bands(['band 999'])
print("Dropping a non-existent band leaves the content unchanged:")
print("  same number of rows ->", len(lc_noop.ydata) == len(lc2d_synth_1comp.ydata))
print("  same unique bands    ->", np.array_equal(np.unique(lc_noop.band), np.unique(lc2d_synth_1comp.band)))

# 2. Invalid selectors
cases = [
    ("bare string", lambda: lc2d_synth_1comp.drop_bands("band 2")),
    ("numeric selector", lambda: lc2d_synth_1comp.drop_bands([2])),
]

for label, func in cases:
    try:
        _ = func()
        print(f"{label}: unexpectedly succeeded")
    except Exception as e:
        print(f"{label}: {type(e).__name__}: {e}")
        print("")

# 3. Removing all available bands
try:
    all_bands = list(np.unique(lc2d_synth_1comp.band))
    _ = lc2d_synth_1comp.drop_bands(all_bands)
    print("remove all bands: unexpectedly succeeded")
except Exception as e:
    print(f"remove all bands: {type(e).__name__}: {e}")
    print("")
Dropping a non-existent band leaves the content unchanged:
  same number of rows -> True
  same unique bands    -> True
bare string: TypeError: 'bands' must be a sequence of labels (list, tuple, or numpy.ndarray), not a bare string. To drop a single band wrap it in a list: drop_bands(['band 2'])

numeric selector: TypeError: Each element of 'bands' must be a string; got 'int'.

remove all bands: ValueError: All rows were removed by drop_bands; no data remains.
merge
Data from one Lightcurve object can be merged into another by appending one or more new bands.
Important behavior in the current code base:
merge()requiresselfto be a 2DLightcurveothermust be:another
Lightcurve, orthe path to a CSV file containing a light curve
othermust represent new constituent band(s):duplicate band labels are conflicts
duplicate wavelengths are also conflicts
by default, conflicts raise a
ValueErrorwith
on_conflict="skip", conflicting constituent bands are skipped with aUserWarningmerge()returns a new 2DLightcurve; it does not modify the original in place
Also note:
if
otheris 1D, you must supplywavelength=...if a 1D
otherhas nobandattribute, you must also supplyband=...if
otheris already 2D, you must not supplywavelength
[40]:
lc123 = lc23.merge(lc1)

print("merge returns a new object:")
print("  lc123 is lc23 ->", lc123 is lc23)
print("  lc123 is lc1  ->", lc123 is lc1)

print(f"\nNo. of observations in lc123: {lc123.xdata[:, 1].shape}")
print("Breakdown by band:")
u, c = np.unique(lc123.band, return_counts=True)
for uu, cc in zip(u, c):
    print(uu, cc)
merge returns a new object:
  lc123 is lc23 -> False
  lc123 is lc1  -> False

No. of observations in lc123: torch.Size([106])
Breakdown by band:
band 1 38
band 2 35
band 3 33
merge() also accepts a CSV file name as its argument and reads in the light curve before merging.
This is convenient, but the same conflict rules still apply:
duplicate band labels are not allowed
duplicate wavelengths are not allowed
on_conflict="raise"is the default
[41]:
lc23.to_csv('lightcurve_band23.csv')
lc123 = lc1.merge("lightcurve_band23.csv")
print(f"No. of observations in lc123: {lc123.xdata[:, 1].shape}")
print("Breakdown by band:")
u, c = np.unique(lc123.band, return_counts=True)
for uu, cc in zip(u, c):
  print(uu, cc)
No. of observations in lc123: torch.Size([106])
Breakdown by band:
band 1 38
band 2 35
band 3 33
If the CSV file contains a 1D light curve, merge() needs enough information to promote it to 2D.
That means:
wavelength=...is requiredif the 1D input has no
bandattribute, you must also passband=...
Without this information, the 1D input cannot be turned into a constituent band of a 2D light curve.
[42]:
lc1.to_csv("lightcurve_band1.csv")
lc123 = lc23.merge("lightcurve_band1.csv", wavelength=0.8)
print(f"No. of observations in lc123: {lc123.xdata[:, 1].shape}")
print("Breakdown by band:")
u, c = np.unique(lc123.band, return_counts=True)
for uu, cc in zip(u, c):
  print(uu, cc)
No. of observations in lc123: torch.Size([106])
Breakdown by band:
b 38
band 2 35
band 3 33
[43]:
# Failure cases for merge()

# 1. Attempt to merge a duplicate band / wavelength
try:
    _ = lc23.merge(lc23)
    print("duplicate merge: unexpectedly succeeded")
except Exception as e:
    print("duplicate merge:", type(e).__name__, e)

# 2. The same duplicate merge, but skipping conflicts
try:
    lc_skip = lc23.merge(lc23, on_conflict="skip")
    print("\nmerge(..., on_conflict='skip') succeeded")
    print("Unique bands in result:", np.unique(lc_skip.band))
except Exception as e:
    print("skip-conflict merge failed:", type(e).__name__, e)
    print("")

# 3. Supplying wavelength for an already-2D input is not allowed
try:
    _ = lc23.merge(lc1, wavelength=0.8)
    print("2D merge with wavelength: unexpectedly succeeded")
except Exception as e:
    print("\n2D merge with wavelength:", type(e).__name__, e)
    print("")
duplicate merge: ValueError Conflict detected: band np.str_('band 2') already exists in 'self'. Use on_conflict='skip' to skip conflicting bands.

merge(..., on_conflict='skip') succeeded
Unique bands in result: ['band 2' 'band 3']

2D merge with wavelength: ValueError 'wavelength' must not be provided when 'other' is already a 2-D lightcurve.
/tmp/ipykernel_2728/2310318970.py:12: UserWarning: Skipping band np.str_('band 2') from 'other': band np.str_('band 2') already exists in 'self'.
  lc_skip = lc23.merge(lc23, on_conflict="skip")
/tmp/ipykernel_2728/2310318970.py:12: UserWarning: Skipping band np.str_('band 3') from 'other': band np.str_('band 3') already exists in 'self'.
  lc_skip = lc23.merge(lc23, on_conflict="skip")
concat
Lightcurve.concat() combines multiple light curves into a new 2D Lightcurve.
Compared with merge():
merge()is an instance method operating on one base object plus one additional inputconcat()is a class method that combines a list of inputs
Like merge(), concat() enforces uniqueness of constituent bands:
no duplicate band labels
no duplicate wavelengths
It also supports a mixture of inputs:
LightcurveobjectsCSV file names
For a 1D input, promotion to 2D is only possible if the object already carries enough wavelength metadata internally. Otherwise concat() raises an error.
[44]:
lc123 = Lightcurve.concat([lc1, lc23])
lc123 = Lightcurve.concat(["lightcurve_band23.csv", lc1])
concat() checks for duplicate constituent bands across all inputs.
A conflict is triggered if either of the following appears in more than one input:
the same band label
the same wavelength
By default this raises a ValueError.
[45]:
lc_1 = lc1
try:
  lc123 = Lightcurve.concat([lc1, lc23, lc_1])
except Exception as e:
  print(type(e).__name__, e)
ValueError Conflict detected: band np.str_('band 1') appears in more than one input. Use on_conflict='skip' to skip conflicting bands.
on_conflict="raise" is the default so that duplicate constituent bands are not ignored silently.
If on_conflict="skip" is used, conflicting bands are skipped and a UserWarning is emitted instead.
One more important difference from merge():
concat()cannot always promote a 1D light curve automaticallythe 1D object must already carry a scalar wavelength internally (for example in
wavelength,wave, orlambda_)otherwise
concat()raises aValueError
[46]:
lc_1 = lc1
lc123 = Lightcurve.concat([lc1, lc23, lc_1], on_conflict="skip")
/tmp/ipykernel_2728/2348824447.py:2: UserWarning: Skipping band np.str_('band 1'): band np.str_('band 1') appears in more than one input.
  lc123 = Lightcurve.concat([lc1, lc23, lc_1], on_conflict="skip")
[47]:
# Additional concat failure mode:
# a 1D input cannot be promoted to 2D unless it carries scalar wavelength metadata

lc1d_no_wavelength = Lightcurve(
    lc1d_manual.xdata,
    lc1d_manual.ydata,
    yerr=lc1d_manual.yerr,
    band=lc1d_manual.band,
)

# Remove possible scalar wavelength metadata if present
for attr in ("wavelength", "wave", "lambda_"):
    if hasattr(lc1d_no_wavelength, attr):
        try:
            setattr(lc1d_no_wavelength, attr, None)
        except Exception:
            pass

try:
    _ = Lightcurve.concat([lc23, lc1d_no_wavelength])
    print("concat with 1D input lacking wavelength metadata: unexpectedly succeeded")
except Exception as e:
    print("concat with 1D input lacking wavelength metadata:", type(e).__name__, e)
concat with 1D input lacking wavelength metadata: ValueError All inputs must have band information if any one of them does. Found a mix of inputs with and without 'band'.
Copy vs in-place semantics for select_bands, drop_bands, merge, and concat
[48]:
# Demonstrate copy vs in-place semantics for the main manipulation methods

print("Original unique bands in lc2d_synth_1comp:")
print(np.unique(lc2d_synth_1comp.band))

# 1. select_bands without assignment: original object is unchanged
_ = lc2d_synth_1comp.select_bands(['band 2'])
print("\nAfter calling select_bands(...) without assignment:")
print(np.unique(lc2d_synth_1comp.band))

# 2. drop_bands without assignment: original object is unchanged
_ = lc2d_synth_1comp.drop_bands(['band 2'])
print("\nAfter calling drop_bands(...) without assignment:")
print(np.unique(lc2d_synth_1comp.band))

# 3. with assignment, a new object is produced
lc_selected = lc2d_synth_1comp.select_bands(['band 2'])
lc_dropped = lc2d_synth_1comp.drop_bands(['band 2'])

print("\nBands in lc_selected:")
print(np.unique(lc_selected.band))

print("\nBands in lc_dropped:")
print(np.unique(lc_dropped.band))

print("\nObject identity checks:")
print("lc_selected is lc2d_synth_1comp ->", lc_selected is lc2d_synth_1comp)
print("lc_dropped  is lc2d_synth_1comp ->", lc_dropped is lc2d_synth_1comp)

# 4. merge also returns a new object
lc_merged = lc_selected.merge(lc_dropped)
print("\nlc_merged is lc_selected ->", lc_merged is lc_selected)
print("lc_merged is lc_dropped  ->", lc_merged is lc_dropped)

# 5. concat returns a new object
lc_concat = Lightcurve.concat([lc_selected, lc_dropped])
print("\nlc_concat is lc_selected ->", lc_concat is lc_selected)
print("lc_concat is lc_dropped  ->", lc_concat is lc_dropped)
Original unique bands in lc2d_synth_1comp:
['band 1' 'band 2' 'band 3']

After calling select_bands(...) without assignment:
['band 1' 'band 2' 'band 3']

After calling drop_bands(...) without assignment:
['band 1' 'band 2' 'band 3']

Bands in lc_selected:
['band 2']

Bands in lc_dropped:
['band 1' 'band 3']

Object identity checks:
lc_selected is lc2d_synth_1comp -> False
lc_dropped  is lc2d_synth_1comp -> False

lc_merged is lc_selected -> False
lc_merged is lc_dropped  -> False

lc_concat is lc_selected -> False
lc_concat is lc_dropped  -> False
Subsampling light curves
Large light curves can become expensive to work with, especially before downstream methods such as fit_LS() and fit().
In the current code base, there are two separate controls:
max_samplesmax_samples_per_band
These do not behave the same way for 1D and 2D light curves.
If the total number of points exceeds max_samples, the object is automatically subsampled and the reduced data are stored in the resulting Lightcurve.
For multiband data, max_samples_per_band is the parameter that actually triggers subsampling. Each band is checked independently, and only bands above the threshold are reduced.
By contrast, for 2D light curves, max_samples is mainly a compute-budget advisory: if the total number of rows is very large, a warning is issued to indicate that later calculations may become slow.
This matters because a 2D Lightcurve stores one row per observation, so memory use and execution time both scale with the total number of rows.
We will demonstrate subsampling on a light curve with a large number of points. We will also demonstrate how subsampling works with a 2D Lightcurve object.
[49]:
# Generate a light curve at a new wavelength with a large number of data points
n_per_band = (5000, 10000) # number of data points per light curve limited to this range
# generate a set of light curves with two period components and a phase lag
# dataset_type="make_multi_sinusoid_chromatic_2d", # series of synthetic light curves with two period components and a phase lag
MULTI_DATASET_CONFIG = dict(
components=[
{"period": 150.0, "amplitude_fraction": 1.0, "phase": 0.0},
{"period": 66.0, "amplitude_fraction": 0.3, "phase": np.pi / 2 * 0.85},
],
t_span=150 * 2.3,
n_per_band=n_per_band,
wavelengths=[0.95],
amplitude_law="extinction",
noise_level=0.05,
seed=SEED,
)
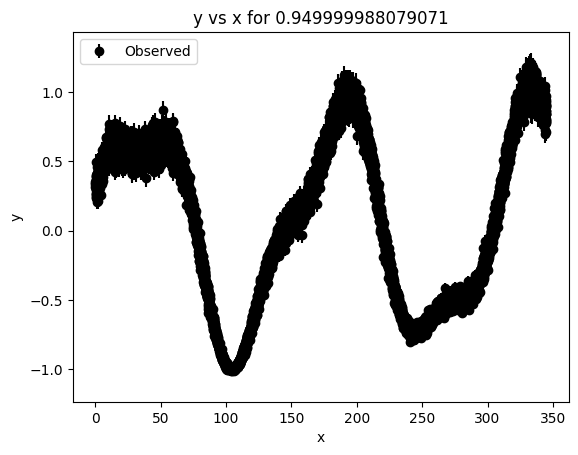
lc1_5 = synthetic.make_multi_sinusoid_chromatic_2d(**MULTI_DATASET_CONFIG)
lc1_5.band = np.repeat('band 1.5', lc1_5.xdata[:, 0].shape)
lc1_5.plot()
/usr/local/lib/python3.12/dist-packages/pgmuvi/synthetic.py:907: UserWarning: Lightcurve has 9253 points, which exceeds max_samples=1000. Execution may be slow. Consider setting max_samples_per_band to reduce the total size of the lightcurve.
  return Lightcurve(x, y, yerr=yerr)
[49]:
[<Figure size 640x480 with 1 Axes>]
Note the UserWarning that already suggests adjusting two arguments: max_samples and max_samples_per_band. These are explained below.
Let us first merge this new light curve into the existing data:
[50]:
lc123 = Lightcurve.from_csv("lightcurve_band123.csv")

lc1234 = lc123.merge(lc1_5)
print(lc1234.xdata.shape)
print(np.unique(lc1234.band))
torch.Size([9359, 2])
['band 1' 'band 1.5' 'band 2' 'band 3']
/usr/local/lib/python3.12/dist-packages/pgmuvi/lightcurve.py:10574: UserWarning: Lightcurve has 9359 points, which exceeds max_samples=1000. Execution may be slow. Consider setting max_samples_per_band to reduce the total size of the lightcurve.
  return type(self)(
PGMUVI can generate a report summarising the sampling quality of the data. Based on various criteria (see preprocess/quality.py), the code suggests whether a band should be included when executing fit_LS or fit.
There are two related but distinct interfaces here:
.compute_sampling_metrics()/.compute_sampling_metrics_per_band()These return numerical diagnostics such as:number of points
baseline
median and mean cadence
Nyquist period
Nyquist frequency
longest detectable period
maximum gap fraction
duty cycle
.assess_sampling_quality()/.assess_sampling_quality_per_band()These apply threshold-based quality gates and return a recommendation about whether the light curve is suitable for later analysis.
The second interface is what is used internally when a Lightcurve is instantiated with check_sampling=True.
For 2D light curves, check_sampling=True checks each wavelength independently. Bands that fail are removed automatically, and a ValueError is raised only if no bands pass.
[51]:
# Numerical sampling diagnostics per band

sampling_metrics = lc1234.compute_sampling_metrics_per_band()

print("Summary:")
print(sampling_metrics["summary"])

print("\nPer-band metrics:")
for wl, metrics in sampling_metrics.items():
    if wl == "summary":
        continue
    print(f"\nWavelength = {wl}")
    print(f"  n_points                  = {metrics['n_points']}")
    print(f"  baseline                  = {metrics['baseline']:.3f}")
    print(f"  median_cadence            = {metrics['median_cadence']:.3f}")
    print(f"  mean_cadence              = {metrics['mean_cadence']:.3f}")
    print(f"  nyquist_period            = {metrics['nyquist_period']:.3f}")
    print(f"  nyquist_frequency         = {metrics['nyquist_frequency']:.6f}")
    print(f"  longest_detectable_period = {metrics['longest_detectable_period']:.3f}")
    print(f"  max_gap_fraction          = {metrics['max_gap_fraction']:.3f}")
    print(f"  duty_cycle                = {metrics['duty_cycle']:.3f}")

print("\nQuality-gate assessment:")
sampling_quality = lc1234.assess_sampling_quality_per_band(verbose=False)
print(sampling_quality["summary"])
Summary:
{'n_bands': 4, 'min_points_across_bands': 33, 'max_gap_fraction_worst_band': 0.15367545487568915, 'median_nyquist_period': 12.191802978515625}
Per-band metrics:
Wavelength = 0.800000011920929
n_points = 38
baseline = 343.093
median_cadence = 5.649
mean_cadence = 9.273
nyquist_period = 11.298
nyquist_frequency = 0.088508
longest_detectable_period = 171.546
max_gap_fraction = 0.125
duty_cycle = 0.626
Wavelength = 0.949999988079071
n_points = 9253
baseline = 344.962
median_cadence = 0.026
mean_cadence = 0.037
nyquist_period = 0.053
nyquist_frequency = 18.933858
longest_detectable_period = 172.481
max_gap_fraction = 0.001
duty_cycle = 0.708
Wavelength = 1.2000000476837158
n_points = 35
baseline = 333.439
median_cadence = 6.543
mean_cadence = 9.807
nyquist_period = 13.085
nyquist_frequency = 0.076423
longest_detectable_period = 166.719
max_gap_fraction = 0.154
duty_cycle = 0.687
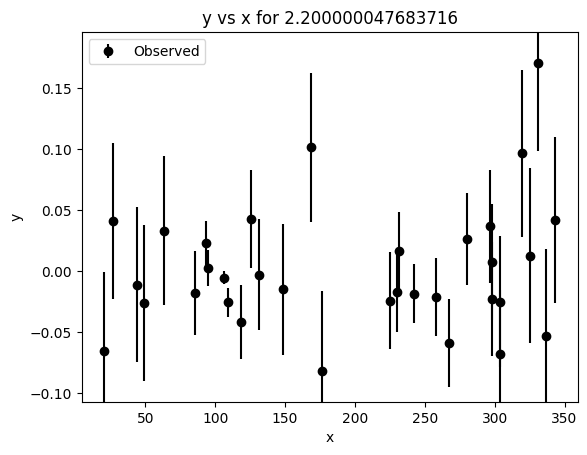
Wavelength = 2.200000047683716
n_points = 33
baseline = 322.731
median_cadence = 7.350
mean_cadence = 10.085
nyquist_period = 14.700
nyquist_frequency = 0.068029
longest_detectable_period = 161.366
max_gap_fraction = 0.152
duty_cycle = 0.752
Quality-gate assessment:
{'n_bands': 4, 'n_passing': 2, 'passing_wavelengths': [0.800000011920929, 0.949999988079071], 'failing_wavelengths': [1.2000000476837158, 2.200000047683716]}
[52]:
# Demonstrate what check_sampling=True does during Lightcurve construction.
#
# For a 2D light curve, each band is checked independently.
# Bands that fail the sampling criteria are removed automatically.

lc_checked = Lightcurve(
    lc1234.xdata,
    lc1234.ydata,
    yerr=lc1234.yerr,
    band=lc1234.band,
    check_sampling=True,
)

print("Original wavelengths:")
print(np.unique(lc1234.xdata[:, 1]))

print("\nRetained wavelengths after check_sampling=True:")
print(np.unique(lc_checked.xdata[:, 1]))

print("\nOriginal observation count:", len(lc1234.ydata))
print("Retained observation count:", len(lc_checked.ydata))
Original wavelengths:
[0.8  0.95 1.2  2.2 ]

Retained wavelengths after check_sampling=True:
[0.8  0.95]

Original observation count: 9359
Retained observation count: 9291
/tmp/ipykernel_2728/4055812079.py:6: UserWarning: Skipping band λ=1.2000000476837158 due to poor temporal sampling: Poor SNR: median=2.4 < 3.0, fraction>=3.0=29% < 50%
  lc_checked = Lightcurve(
/tmp/ipykernel_2728/4055812079.py:6: UserWarning: Skipping band λ=2.200000047683716 due to poor temporal sampling: Poor SNR: median=0.6 < 3.0, fraction>=3.0=0% < 50%
  lc_checked = Lightcurve(
/tmp/ipykernel_2728/4055812079.py:6: UserWarning: Retaining 2/4 wavelength bands after sampling-quality filtering (skipping λ = [1.2, 2.2]).
  lc_checked = Lightcurve(
/tmp/ipykernel_2728/4055812079.py:6: UserWarning: Lightcurve has 9291 points, which exceeds max_samples=1000. Execution may be slow. Consider setting max_samples_per_band to reduce the total size of the lightcurve.
  lc_checked = Lightcurve(
A single light curve can be subsampled as follows:
[53]:
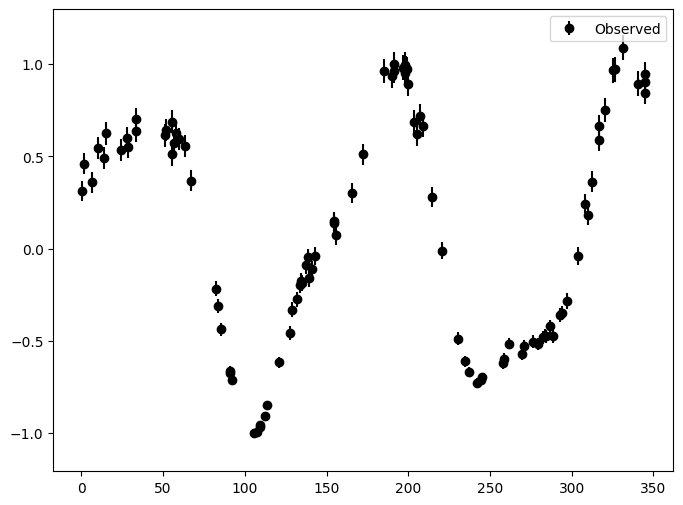
idx = subsample_lightcurve(lc1_5.xdata[:, 0], max_samples=100)
lc_sub = Lightcurve(xdata=lc1_5.xdata[idx, 0], ydata=lc1_5.ydata[idx],
                    yerr=lc1_5.yerr[idx], band=[lc1_5.band[idx[0]]])
_ = lc1_5.plot()
_ = lc_sub.plot()

The max_samples_per_band argument determines which bands in a 2D Lightcurve object need to be subsampled.
Bands with fewer than max_samples_per_band points are left unchanged.
However, there is an important practical distinction:
max_samples_per_bandcontrols automatic row reductionmax_samplescontrols the warning threshold for the total number of rows in a 2D light curve
So for large 2D datasets:
increasing
max_samples_per_bandpreserves more information but may slow later analysisdecreasing
max_samples_per_bandreduces the per-band row count and can make later methods more tractablesetting
max_samplesto a larger value suppresses warnings, but does not itself reduce the size of a 2D light curve
In short: for 2D light curves, max_samples_per_band is the real performance knob.
[54]:
_ = lc1234.to_csv("lightcurve_bands1234.csv")
print(f"No. of observations in lc1234: {lc1234.xdata[:, 1].shape}")
print("Breakdown by band:")
u, c = np.unique(lc1234.band, return_counts=True)
for uu, cc in zip(u, c):
  print(uu, cc)
No. of observations in lc1234: torch.Size([9359])
Breakdown by band:
band 1 38
band 1.5 9253
band 2 35
band 3 33
We set max_samples such that subsampling is only applied to the band that actually needs it:
[55]:
lc = Lightcurve.from_csv("lightcurve_bands1234.csv", max_samples=1000,
                         max_samples_per_band=98)
/usr/local/lib/python3.12/dist-packages/pgmuvi/lightcurve.py:824: UserWarning: The following bands exceed max_samples_per_band=98 and were randomly subsampled: λ=0.949999988079071. Set max_samples_per_band=None to disable subsampling.
The subsampled 2D light curve has the following structure:
    λ=0.800000011920929: 38 points
    λ=0.949999988079071: 98 points
    λ=1.2000000476837158: 35 points
    λ=2.200000047683716: 33 points
  return cls(xdata=x, ydata=y, yerr=yerr, **kwargs)
[56]:
# Simple size / memory sanity check before and after subsampling

def lightcurve_size_report(lc_obj, label):
    x_nbytes = np.asarray(lc_obj.xdata).nbytes
    y_nbytes = np.asarray(lc_obj.ydata).nbytes
    yerr_nbytes = 0 if lc_obj.yerr is None else np.asarray(lc_obj.yerr).nbytes
    band_nbytes = 0 if getattr(lc_obj, "band", None) is None else np.asarray(lc_obj.band).nbytes

    print(label)
    print(f"  n_rows               = {len(lc_obj.ydata)}")
    print(f"  xdata shape          = {np.asarray(lc_obj.xdata).shape}")
    print(f"  ydata shape          = {np.asarray(lc_obj.ydata).shape}")
    print(f"  approx numeric bytes = {x_nbytes + y_nbytes + yerr_nbytes}")
    print(f"  approx band bytes    = {band_nbytes}")
    print(f"  approx total bytes   = {x_nbytes + y_nbytes + yerr_nbytes + band_nbytes}")

print("Before subsampling:")
lightcurve_size_report(lc1234, "lc1234")

print("\nAfter subsampling:")
lightcurve_size_report(lc, "lc")
Before subsampling:
lc1234
  n_rows               = 9359
  xdata shape          = (9359, 2)
  ydata shape          = (9359,)
  approx numeric bytes = 149744
  approx band bytes    = 299488
  approx total bytes   = 449232

After subsampling:
lc
  n_rows               = 204
  xdata shape          = (204, 2)
  ydata shape          = (204,)
  approx numeric bytes = 3264
  approx band bytes    = 6528
  approx total bytes   = 9792
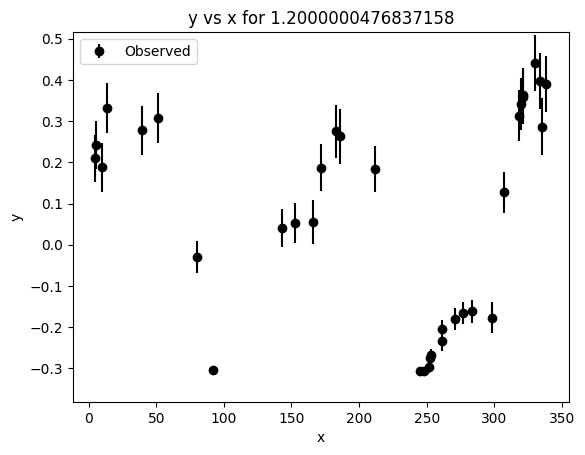
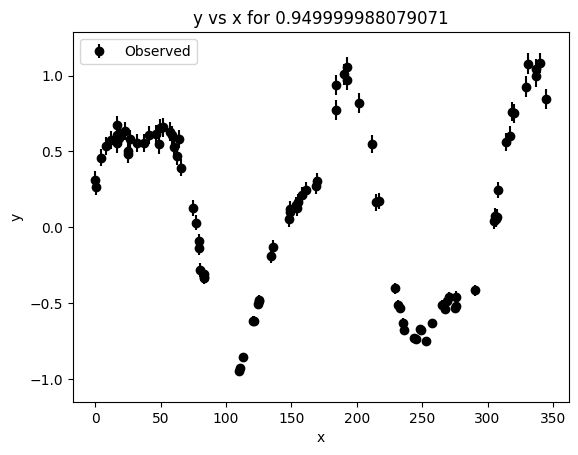
We can visualize the subsampled Lightcurve object:
[57]:
_ = lc.plot()

Statistical tests for variability
PGMUVI can run simple statistical tests to determine whether the light curve at a given wavelength shows statistically significant variability. This is useful for deciding whether a band is worth sending to later analysis steps.
The variability logic uses three reported quantities:
Weighted chi-squared test
tests whether the light curve is consistent with a constant value within the reported uncertainties
reported via
chi2,dof, andp_value
Fractional variability,
F_varmeasures whether the intrinsic variability amplitude is astrophysically meaningful after accounting for measurement errors
compared against the threshold
fvar_min
Stetson K
reported as a diagnostic shape/coherence metric
compared against
stetson_k_minimportant: in the current code base, this does not veto a light curve that already passes the required chi-squared and
F_vartests
For a 2D Lightcurve, the method .check_variability_per_band() evaluates each wavelength independently and returns:
one diagnostics dictionary per wavelength
a summary giving the number of variable bands and their wavelengths
Bands can then be filtered automatically with .filter_variable_bands().
Below, we first inspect the full per-band diagnostics, and then demonstrate how to retain only the bands that pass the required variability gates.
[58]:
variability_results = lc1234.check_variability_per_band()

print("Summary:")
print(variability_results["summary"])

print("\nPer-band diagnostics:")
for wl, diag in variability_results.items():
    if wl == "summary":
        continue

    print(f"\nWavelength = {wl}")
    print(f"  n_points   = {diag['n_points']}")
    print(f"  chi2       = {diag['chi2']:.3f}")
    print(f"  dof        = {diag['dof']}")
    print(f"  p_value    = {diag['p_value']:.6g}")
    print(f"  F_var      = {diag['fvar']:.6f}")
    print(f"  Stetson K  = {diag['stetson_k']:.6f}")
    print(f"  decision   = {diag['decision']}")
    print(f"  tests      = {diag['tests_passed']}")
Summary:
{'n_bands': 4, 'n_variable': 3, 'variable_wavelengths': [0.800000011920929, 0.949999988079071, 1.2000000476837158]}

Per-band diagnostics:

Wavelength = 0.800000011920929
  n_points   = 38
  chi2       = 5971.864
  dof        = 37
  p_value    = 0
  F_var      = 6.291266
  Stetson K  = 0.890367
  decision   = VARIABLE; DIAGNOSTIC: stetson_k=0.890<ref=0.950
  tests      = {'chi2_test': True, 'fvar_test': True, 'stetson_test': False, 'min_points': True}

Wavelength = 0.949999988079071
  n_points   = 9253
  chi2       = 3085250.623
  dof        = 9252
  p_value    = 0
  F_var      = 7.141045
  Stetson K  = 0.853211
  decision   = VARIABLE; DIAGNOSTIC: stetson_k=0.853<ref=0.950
  tests      = {'chi2_test': True, 'fvar_test': True, 'stetson_test': False, 'min_points': True}

Wavelength = 1.2000000476837158
  n_points   = 35
  chi2       = 450.622
  dof        = 34
  p_value    = 3.19429e-74
  F_var      = 5.267337
  Stetson K  = 0.892560
  decision   = VARIABLE; DIAGNOSTIC: stetson_k=0.893<ref=0.950
  tests      = {'chi2_test': True, 'fvar_test': True, 'stetson_test': False, 'min_points': True}

Wavelength = 2.200000047683716
  n_points   = 33
  chi2       = 26.952
  dof        = 32
  p_value    = 0.720074
  F_var      = 0.820750
  Stetson K  = 0.810382
  decision   = NOT VARIABLE: p_value=0.7201 >= alpha=0.01; DIAGNOSTIC: stetson_k=0.810<ref=0.950
  tests      = {'chi2_test': False, 'fvar_test': True, 'stetson_test': False, 'min_points': True}
[59]:
# Keep only bands that pass the required variability gates.
# In the current implementation, Stetson K is diagnostic only:
# a band is kept if it passes the chi2 and F_var requirements.

lc_variable = lc1234.filter_variable_bands()

print("Original wavelengths:")
print(np.unique(lc1234.xdata[:, 1]))

print("\nWavelengths retained after variability filtering:")
print(np.unique(lc_variable.xdata[:, 1]))

print("\nOriginal number of observations:", len(lc1234.ydata))
print("Retained number of observations:", len(lc_variable.ydata))
Original wavelengths:
[0.8  0.95 1.2  2.2 ]

Wavelengths retained after variability filtering:
[0.8  0.95 1.2 ]

Original number of observations: 9359
Retained number of observations: 9326
/usr/local/lib/python3.12/dist-packages/pgmuvi/lightcurve.py:5111: UserWarning: Lightcurve has 9326 points, which exceeds max_samples=1000. Execution may be slow. Consider setting max_samples_per_band to reduce the total size of the lightcurve.
  return Lightcurve(new_x, new_y, yerr=new_yerr)